
Your CAC is climbing, your ad spend is spread across Meta, Google UAC, and Apple Search Ads, and your attribution dashboard is telling you which installs came from where — but not why some channels drive retained users while others drain budget. Traditional broadcast metrics like gross rating points might feel like a relic from TV planning spreadsheets, but that assumption is costing you clarity.
GRP gives you a precise vocabulary for reach and frequency that applies directly to any channel where impressions are bought, including mobile. This article translates broadcast measurement concepts into workflows mobile developers can actually use — mapping GRP against ROAS, CAC, and CPM, and showing you how to pull and interpret GRP-equivalent data from the ad networks you're already running.
What Are Gross Rating Points? The GRP Definition Mobile Developers Need
GRP Definition: Reach × Frequency in Plain Terms
GRP = Reach (%) × Frequency. That's the entire formula. If your campaign reaches 30% of your target audience and each person sees your ad an average of 4 times, your GRP is 120.
Reach is expressed as a percentage of your defined audience, not a raw headcount. Frequency is the average number of exposures per person. Multiply them and you get a single number that describes the total weight of your campaign — independent of audience size.
TRPs Meaning: How Target Rating Points Differ from GRPs
TRPs meaning is simply GRP scoped to a specific demographic segment. Where GRP measures reach against a general population, a Target Rating Point measures reach against your defined target audience only.
For mobile developers, this distinction is operationally critical. If you're targeting iOS 17+ users in Germany, your TRP denominator is that specific pool — not all smartphone users in the country. Running GRP calculations against the wrong denominator inflates your apparent reach and produces budgeting decisions based on bad math.
The Formula Behind GRP and Why It Matters for Budgeting
GRP gives you a channel-agnostic measure of campaign pressure. A campaign with 200 GRP delivered more total exposure weight than one with 80 GRP, regardless of the platform.
For budget allocation, this matters because it lets you compare reach-and-frequency efficiency across channels that report metrics differently. A programmatic DSP reports impressions; a podcast network reports downloads; GRP normalises both into a comparable unit. Mobile developers working across mixed channel mixes can use GRP as a common denominator before converting to performance metrics downstream.
How to Interpret a Gross Rating Point: A Framework for Mobile Campaigns
What a GRP Score Actually Tells You (and What It Doesn't)
A GRP of 1 means 1% of your target audience was exposed to your ad once. A GRP of 120 means the average member of your target audience was exposed roughly 3 times across 40% reach — or some other reach-frequency combination that multiplies to 120. GRP is a measure of cumulative exposure weight, not engagement, intent, or conversion.
This matters for mobile campaigns because a GRP score tells you whether your message had enough market coverage to register — it tells you nothing about what users did after exposure.
GRP Benchmarks: What Range Signals Effective Brand Awareness
A GRP of 100–300 is generally considered effective for brand awareness campaigns, calculated by multiplying reach percentage by frequency (Source: excellentpublicity.com). For mobile app campaigns targeting a narrow segment, reaching the lower end of that range efficiently is often more valuable than a high GRP spread across a poorly matched audience.
Use this table as a practical reference when interpreting GRP outputs from your media plan:
| GRP Range | Signal | Mobile Campaign Interpretation |
|---|---|---|
| Under 100 | Low reach or frequency | Awareness likely insufficient; consider expanding reach or increasing frequency |
| 100–300 | Effective awareness zone | Healthy for brand recall; supplement with install and ROAS data |
| 300+ | High exposure weight | Risk of ad fatigue; check frequency caps and monitor CPM efficiency |
Common Misreading: GRP Is Not an Exact Viewer Count
GRP does not directly measure actual viewership — a common misconception is that it provides exact viewer numbers (Source: advertisemint.com). A GRP of 150 does not mean 150% of your audience saw the ad; it means the cumulative exposure weight equals 150 rating points.
For mobile developers pulling reports, this means GRP should never be used as a proxy for unique reach without separate reach data. Always check whether your ad network is reporting unique impressions or total impressions when building GRP calculations.
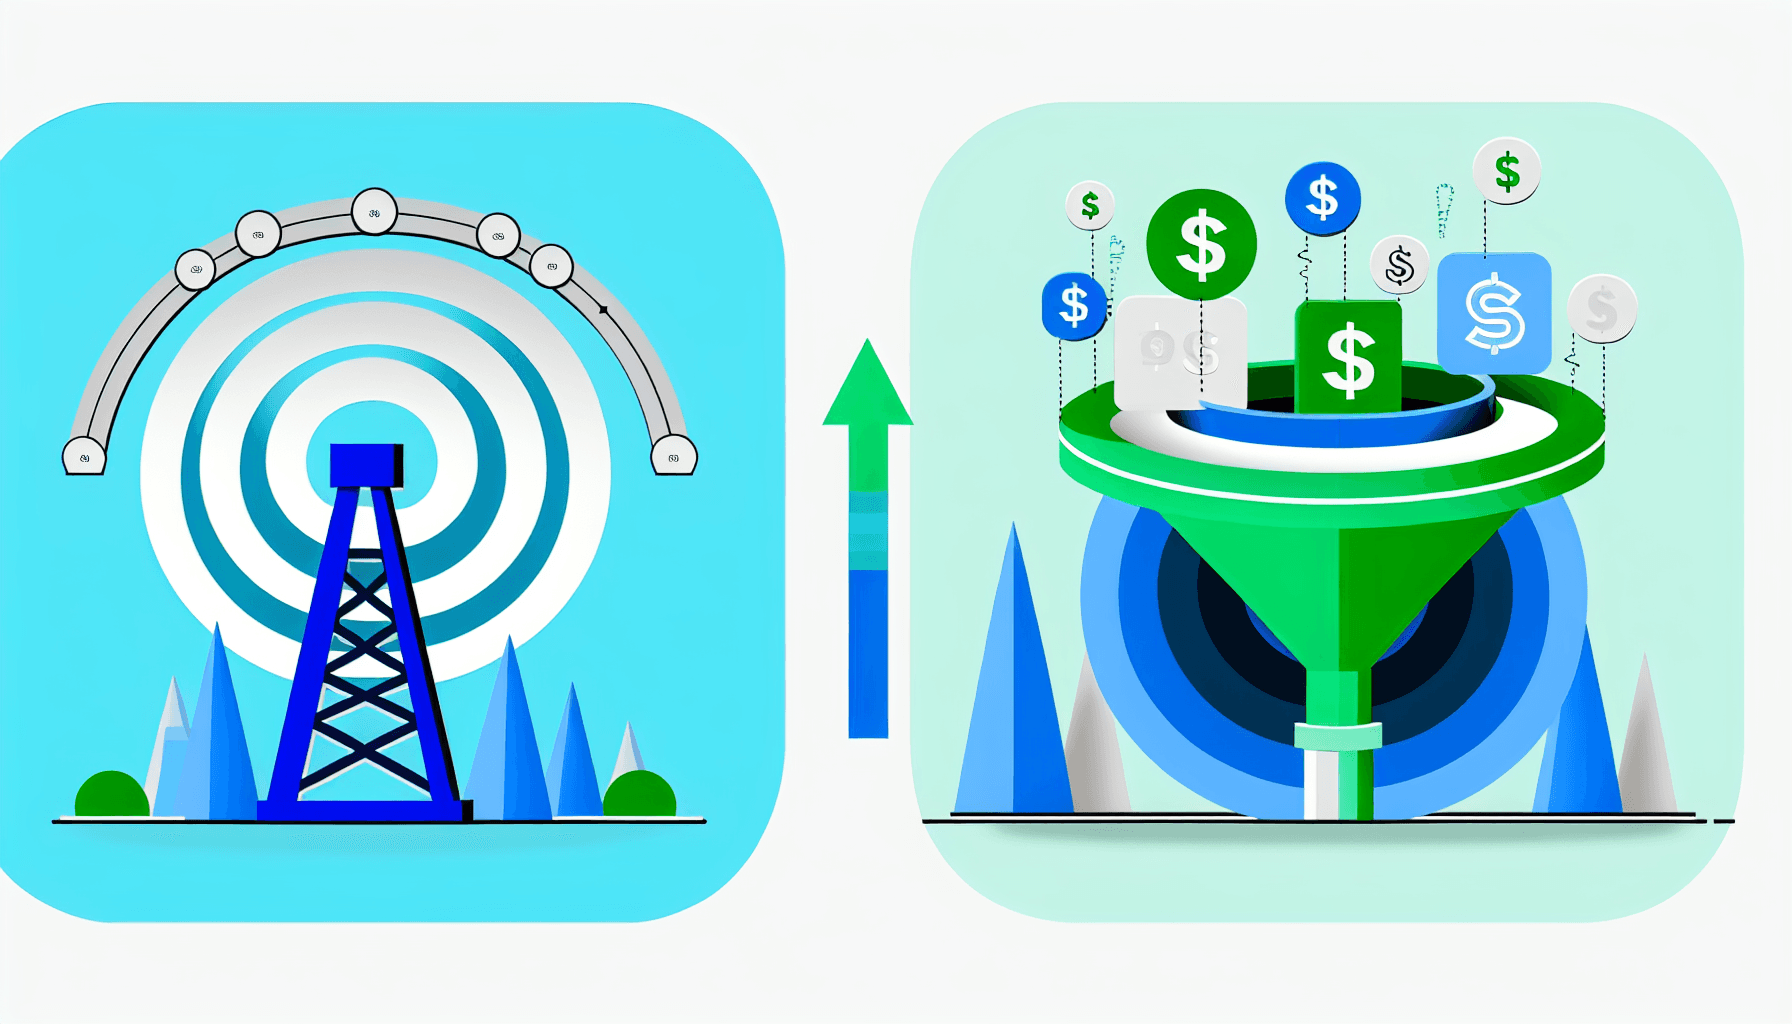
Gross Rating Points vs. Modern Mobile Metrics: ROAS, CAC, and CPM
ROAS Meaning in Mobile App Campaigns and How It Complements GRP
ROAS meaning in mobile is revenue generated per dollar of ad spend — if you spend $1,000 on a campaign that drives $4,000 in in-app purchases, your ROAS is 4x. GRP has no native revenue signal whatsoever. That's not a flaw in GRP; it's a design boundary.
GRP tells you how much exposure pressure your campaign generated. ROAS tells you what that pressure was worth in revenue terms. Running both gives you a complete picture: a campaign with high GRP and low ROAS signals a reach-and-frequency problem that isn't converting, not necessarily a spend problem.
Cost Per Mille Example: Translating CPM Data into GRP-Equivalent Reach
Here's a concrete cost per mille example: if you pay $5 CPM and your ad runs to an audience of 500,000, your total cost is $2,500 and you've delivered 500,000 total impressions. To translate this into a GRP-equivalent, divide total impressions by your target audience size, then multiply by 100.
If your target audience is 200,000 users and you delivered 500,000 impressions, your GRP = (500,000 ÷ 200,000) × 100 = 250 GRP. This calculation lets you benchmark programmatic buys against any other channel using GRP as a normalised unit — useful when you're comparing mobile display against connected TV or audio.
When to Use GRP vs. When to Lean on Installs, LTV, and CAC
Use GRP when you're running upper-funnel campaigns where the objective is awareness and the success criteria is sufficient market coverage. Use installs, LTV, and CAC when you're running performance campaigns where every dollar must trace to a downstream event.
The mistake is treating them as alternatives. For any mobile developer running mixed-funnel campaigns simultaneously, GRP is the reach-and-frequency input; ROAS and CAC are the output measures. Neither replaces the other.
How Mobile Developers Can Track Gross Rating Points Across App Campaigns
Step 1 — Define Your Reachable Audience Denominator for Mobile
Before you calculate any GRP, define the denominator: the total number of users in your target segment. This might be all iOS users in your target market, or a narrower cohort like users aged 25–34 who have previously installed a competitor app.
Most mobile advertising platforms let you define this audience at the campaign level. Export that defined audience size and store it as your fixed denominator for all GRP calculations tied to that campaign.
Step 2 — Pull Impression and Frequency Data from Your Ad Networks
Each major ad network surfaces this data differently. In Meta Ads Manager, find impression volume and average frequency under the Delivery columns in campaign reporting. In Google UAC, impression data lives in the campaign-level report under Reach and Frequency (available when you run reach-optimised campaigns). Apple Search Ads surfaces impressions directly in the campaign dashboard. Programmatic DSPs typically export impression logs that include frequency capping metadata.
Pull total impressions and average frequency per user from each network. These are your raw inputs for GRP calculation.
Step 3 — Map GRP Outputs into Your Attribution Dashboard
With impression totals and your audience denominator in hand, calculate reach percentage: (unique users reached ÷ total target audience) × 100. Multiply by average frequency. That's your GRP.
Map this output into your attribution dashboard alongside installs, ROAS, and CAC so you can track whether exposure weight correlates with downstream performance. One important data integrity warning: Nielsen's measurement methodology update resulted in a 20% across-the-board increase in reported GRPs under the new system (Source: insideradio.com). If you're benchmarking your GRP against industry reports, always verify which measurement methodology was used — a 120 GRP benchmark from a pre-update report is not the same as a 120 GRP calculated today.
How Mobile Advertising Platforms Surface GRP-Equivalent Data
Most mobile advertising platforms don't label this data as GRP — they report impressions, reach, and frequency as separate fields. Your job as the developer or growth engineer is to combine them using the formula above.
Automate this calculation in your data warehouse if you're pulling reports via API. Both Meta's Marketing API and Google Ads API expose reach and frequency fields at the campaign level, making it straightforward to calculate GRP programmatically rather than manually.
Limitations of Gross Rating Points for Mobile-First Campaigns
GRP Assumes a Homogeneous Audience — Mobile Doesn't Have That
GRP was designed for broadcast channels where the audience is a statistical average — a TV rating assumes all viewers in that slot are equivalent. Mobile audiences are not homogeneous. A single campaign can simultaneously reach high-LTV users and zero-intent users who will never install.
This means a high GRP in a mobile campaign can be driven by efficient delivery to the wrong segment. Always segment your reach and frequency data by audience cohort rather than treating GRP as a single campaign-level number.
No Click, Install, or Revenue Signal: The Attribution Gap
GRP gives zero signal on post-install behaviour. It cannot tell you whether the user who saw your ad three times went on to make a purchase, complete onboarding, or churn on day one. For any mobile growth team optimising toward LTV or ROAS, GRP used in isolation is an incomplete and potentially misleading KPI.
Treat GRP as a reach-and-frequency sanity check. It tells you whether your campaign had enough exposure weight to plausibly drive awareness — not whether it actually did.
Privacy Changes and the Future of Reach Measurement on Mobile
ATT, GDPR, and SKAdNetwork are progressively limiting user-level identity on mobile. As deterministic reach measurement becomes harder, GRP — a probabilistic, aggregate metric — may actually become more relevant, not less. But the inputs (unique reach counts) will be modelled rather than observed.
For mobile developers, this means GRP calculations will increasingly rely on modelled reach data from ad networks rather than deterministic impression logs. Build your measurement stack to accommodate modelled inputs and treat reach figures from ATT-constrained campaigns as estimates with confidence intervals, not hard counts.
Frequently Asked Questions
How do you interpret a GRP?
A GRP of 1 means 1% of your target audience was exposed to your ad once. A GRP of 120 means the cumulative exposure weight of your campaign equals 120 rating points — achieved through some combination of reach and frequency that multiplies to 120, such as 40% reach at an average frequency of 3. GRP measures total campaign exposure pressure, not unique viewers or engagement.
How are gross rating points calculated?
GRP is calculated by multiplying Reach (%) by Frequency. Reach is the percentage of your target audience exposed to the ad at least once; frequency is the average number of times each reached person saw it. If you reach 25% of your audience an average of 5 times, GRP = 125.
What is a good GRP score?
A GRP of 100–300 is generally considered effective for brand awareness campaigns (Source: excellentpublicity.com). Below 100 typically indicates insufficient market coverage. Above 300 risks ad fatigue and diminishing returns. For mobile app campaigns targeting narrow segments, hitting the 100–200 range efficiently against a precisely defined audience is usually more valuable than a high GRP against a broad, mismatched population.
How to find gross rating points?
Pull total impressions and unique reach from your ad network dashboards — Meta Ads Manager, Google UAC, Apple Search Ads, or your DSP. Calculate reach percentage by dividing unique users reached by your total target audience size, then multiply by 100. Multiply that reach percentage by average frequency. The result is your GRP for that campaign.
Build a measurement framework, not separate reports.
Running an upper-funnel awareness campaign? GRP gives you a reach-and-frequency baseline that tells you whether your campaign had enough market coverage to register — track it alongside CPM to evaluate spend efficiency at the exposure layer.
Running a performance campaign optimising for installs or ROAS? GRP is an input, not the output. You need an attribution layer that connects impression exposure to downstream app events — installs, purchases, retention — so you can answer whether your reach actually produced anything worth paying for. The next step is building a workflow where GRP, CPM, and ROAS sit together rather than in separate dashboards.